A Digital Twin Example
January 25th, 2022 | by Andreas Richter
(12 min read)
Since we started the GEONATIVES blog we talked about the usefulness of a digital twin (or, as we tag it, data lake). We are using this term for a master database that contains different kinds of data sets such as data needed for operation, pre-processed and cleaned data (see also our feature about data processing) and ancillary data that cannot be derived from the operational data (find more details about data sets for simulation and operation in another feature). But let’s explain the idea and the advantages of the digital twin concept on a tangible example.
Changing World
We are often referring to the different stakeholders of mobility because their number is constantly growing: In the past we had the public authorities that planned, built and maintained roads, and organized energy supply and waste management. That was it! But then Western World decided to put some of the tasks into private hands and we had public private partnerships to plan, build and maintain/operate roads, organize public transport and care about supply and disposal. After that, new mobility players appeared such as providers of taxi services or micro mobility. The public road space got used by advertising companies and local business, the traffic demand rose. In the mobility domain routing for any kind of transportation mode was introduced and connected with advertising, and the automotive domain utilized more and more road network and layout data for their driver assistance and automation systems. The traffic theatre got very crowded and there are still new players such as Mobility-as-a-Service providers interested to join the party.
The previously touched topics can be summarized under the claim of mobility trends. Additionally, there are mega trends having impact on mobility, too. On the one hand urbanization is still on-going even though the pandemic situation put a damper on in-migration. On the other hand climate change creates new challenges for cities so that they do not drown in severe weather or burn in summer. To face these challenges the cities want or have to rebuild. The interesting question is: Which measure has which effect? And the importance is that there is not only one effect but a cascade of effects because everything coheres somehow.
Get the Round Thing into the Square
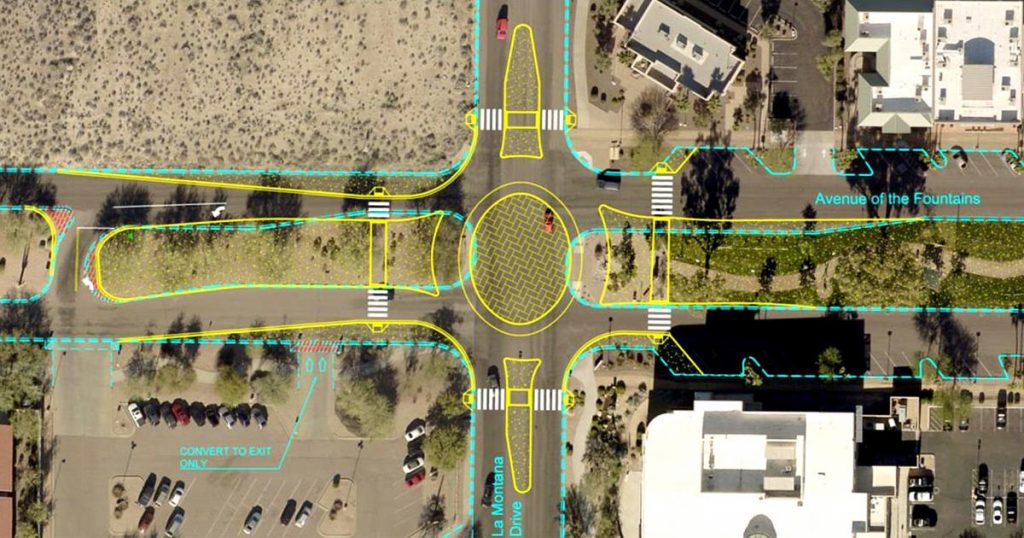
Now let’s get to the promised example: A city administration would like to approach some of these previously mentioned challenges. It would like to reduce individual traffic by reducing the number of lanes of a major road. Also more road space shall be reclaimed for pedestrians and urban green by this measure. The potential of accidents close to downtown shall be reduced by transforming a complex intersection into a roundabout. Additionally, the city would like to introduce on-demand robot bus services and the vehicles have to be parked close to the place of demand. The inner part of the roundabout could be a suitable parking space.
A lot of questions are piling up:
- What will the new road layout look like? Will there be enough space for e.g. the boarding and alighting point and to park additional micro mobility vehicles?
- How much material and (co-operative) infrastructure will be needed to build the new roundabout?
- What impact has the reduction of the number of lanes (reduction of road capacity)?
- What impact will it have on the traffic flow on this intersection? And what impact on city level if traffic participants will reroute?
- Will the parking area of the robot busses support the business?
- And will the parking itself (and the merging of the busses into the traffic) cause new risks (e.g. by distracting other road participants)?
- Will the energy supply network be strong enough to support robot bus charging stations?
- …
…and you may come up with even more questions. How to answer them? Simulation is a good solution! Let’s have a look at the different domains:
Energy Supply
To analyze whether the energy supply network is strong enough, and, what’s more important, whether the network is somewhere close-by in the first place can be answered by having a look into the geodata of the energy supply operator. He should have a geo-referenced network with meta data about the capacity of the power cables as well as their operation capacity. The linking with other data is currently not so crucial, the costs of the extension of the energy network will be calculated by civil engineering in detail.
Traffic Engineering
Before the first stroke of work is done, different concepts of suitable road layouts will be generated by traffic planners. Now the interesting part of the digital twin begins because the data sets of the road layouts should be created and stored in a re-usable way. Ideally it is done in a geo-database using lightweight data formats so that it is easy to transform them into more specialized data formats if necessary (remember our steps of the processing tool chain). The different layouts have to be assessed regarding their effectiveness to reach the mentioned goals. Thus, we need the layouts for different tools in the next processing steps.
One part of the traffic engineering that will become more important in the near future is the simulation of the co-operative intelligent transportation systems (C-ITS). (Stereo) cameras are used to measure the traffic flow and predict the movement of road participants. Vehicle-to-Infrastructure communication will be able to propagate relevant traffic information to the vehicles for coordination purpose. For that antennas will be installed. To find the best location for optimal radio wave propagation condition, ray-tracing-like simulation taking the environment into account is used. A precise road layout description including road features such as road marks and poles help to calibrate optical sensors. But iI’s true, this is only working if the built result is equal to the planned road layout.
Visualization
The first user of the layouts is visualization. 3d environment will be created to get a first impression of what the new scenery will look like. For that it should be beneficial if the new road layouts can be fitted into the already existing 3d urban environment so that the surrounding can bring the new roundabout and street into effect. Citizens wants to know that the new solution will be nice and shiny! Using geo-referenced data could make the visualization alive using augmented reality presented on site.
It is true that a 2d or 3d visualization can be also generated manually. But if the next analysis steps will generate changes this visualization has to be updated, too. And if visualization is connected to the traffic simulation then also the traffic flow of vehicles and pedestrians can be shown in a realistic way instead of having only some clumsy animations. If, despite the mentioned advantages, visualization is generated as last step, all remaining work steps nevertheless will benefit from a digital twin.
Traffic Flow Analysis
One crucial question is the impact on the traffic flow. For that a microscopic traffic simulation can generate an answer but only if there is a properly modeled road network available as well as a traffic demand model reflecting the traffic of the corresponding city.
Now, the road network will be updated in the way of changing the road attributes (reduction of number of lanes) and replacement of the intersection by the roundabout layout proposals. Then, the traffic demand will be applied. Simulation can also be modified to simulate what happens if additional construction sites are blocking other routes to see if the new road situation can also handle heavier traffic than usual. It can also be simulated how easy it will be for priority vehicles to get through the new intersection situation.
Additionally to the road traffic, microscopic traffic simulation can reflect also pedestrians and public transport. It will also be necessary to see what impact the new layout will have on them, too.
Such updated road network will be beneficial later-on for road operations and maintenance as well. The road operator can store all of his assets (road infrastructure, such as road signs and road marks, as well as road furniture, such as barriers or bus shelters) in this data base. If traffic signs are incorporated into the road network and the road layouts reflects also traffic regulations then the impact of newly added features can directly be simulated! Also the effect degradation (e.g. loss of visibility/efficacy) of the assets can be simulated.
As side note: urban green will also be maintained in geo-databases and information about the trees and their size will give a clue about the required amount of watering as well as the generation of biomass that might have to be removed in autumn.
Overall, the traffic flow analysis will give an idea, which road layout is most suitable for the initial goals.
Robot Bus Service Analysis
If the traffic simulation was updated with the new intersection and maybe the traffic demand model updated accordingly, the data can be re-used by the robot bus service provider. On a city scope level the new parking space and boarding and alighting point is introduced and the simulation can show whether the new location pays off. Based on the customer potential of the area it can generate new additional service requests and the assumed journeys can tell what impact this new location will have on distribution of the fleet. The traffic of the robot bus fleet (pick up and drop off of passengers as well as the parking/charging and re-merging into the traffic) will have impact on the traffic flow as well, thus it makes sense to feed-back this information into the traffic flow model of the traffic simulation.
But also on local level it is worth to simulate the service: It will be interesting to see if the robot buses will be able to enter and exit the parking space and boarding and alighting point without any problems and causing trouble to the other road participants.
The precise road description can also be used directly to update the maps of the robot buses. Currently all players in the automated driving domain rely on more or less feature-heavy maps to support localization and micro-routing. It would be great if they could incorporate available data directly right before the construction is started instead of re-surveying everything after the roadworks are finished.
Safety Analysis
The local-level analysis will be also interesting from a safety perspective. If the intersection is transformed into a small mobility hub, more traffic participants will interact which each other and sometimes they will be not fully attentive. Also the merging of the robot busses into the roundabout traffic could be a new experience for the other road users.
All these new situations can have impact on the traffic flow as well and can cause another accident hotspot when one should actually be eliminated. A good way for simulating this and getting feedback from road users is a driving simulator. There, you can create different scenarios and see how test drivers are reacting and ask them how complex and stressful the new situation was experienced. To have proper scenarios also surrounding traffic will be necessary to be simulated and this can be derived from the traffic simulation. The road layout should be derived from the civil engineering dataset so that traffic simulation and driving simulation is working on the same road representation. It also supports the possibility to test different solution candidates. The surroundings should be derived from the city model to recreate a recognizable environment in the driving simulations. You might actually come to the conclusion that such a set up could als be used for the general visualization mentioned earlier and you are absolutely right!
Civil Engineering
If there is one preferred layout it has to be calculated how much time and money it will cost to realize this solution. For that the civil engineering will need the layout as well as information about the underworld (there is the link to the energy supply). In general this information is provided as cadastral data and used to calculate how much soil has to be moved, how many cables have to be laid and supporting hardware to be installed, how much building material has to be bought. The overall schedule will be created based on the different work parts of the construction, the amount of work and availability of professionals and machines. At the end this does not really have to be fed back to the initial data sets but it is easy to use the precise road layout to calculate all necessary parts. But it is worth to update the data set with necessary minor changes e.g. due to the selection of slightly different elements (such as curbs) or position of infrastructure (such as barriers) to keep the data set as close to the intended reality as possible.
After construction is finished often the new scenery is surveyed again to check if the accounting is meeting reality. At least at that point in time the derived data should be used to update the initial road layout and asset data set accordingly to reflect the finally built state.
But costs are also generated during operation. Moreover, infrastructure will get old and have to be replaced in time before the C-ITS fails and may cause issues for the overall traffic management. Again, simulation can help to get an idea about the likely use of the infrastructure. Collecting operational data and updating the simulation model with them helps to create a predictive maintenance model of the used infrastructure. Also the change of the environment (growing vegetation, new buildings, changing climate conditions) can have an impact on the infrastructure: The radio wave propagation is obstructed by increasing size of treetops, new buildings can cause reflections (urban canyon effect) and antennas can fail due to operation temperature. This all could lead to a realignment or replacement of C-ITS.
Additional Municipal Analysis
In addition to the traffic flow analysis more can be applied if larger undertakings are pending. For example, if a new block or commercial area is planned or should be upgraded/rebuilt, also the analysis of environmental effects are becoming important. The new buildings can be analyzed regarding their solar potential. Shadowing or reflection of the surrounding should be calculated to identify positive/negative effects on sojourn quality. The airflow in cities attains more and more importance: It effects the distribution of fresh air and emissions. If the airflow is disrupted the city can heat up.
In addition to the analysis of the static content, the dynamic one has to be considered, too. The traffic will cause noise and emissions. The reflection or dispersal of noise is also a factor that has to be taken into account.
In both cases it is beneficial to insert the new planning into already existing 3d city models and road networks so that the same simulation tools can be re-used and the new city block or commercial area can be assessed in interoperation with the whole city and their surroundings.
Coherence of Data
Different stakeholders need different data about the same location. If every stakeholder has to re-create the environment on their own the scenery is modeled multiple times which leads, among other, to a waste of money. Or the stakeholders are using different data sets with different age and accuracy. In the worst case also the surroundings have to be re-created more than once because such environment model is not available or can’t be imported. If an update of the data set has to be made, the update has to be conducted by all stakeholders. Don’t dare to think about multiple updates due to an agile design and decision process!
Next, the separately created models can differ from each other because they are not fitted to each other and may focus on different details which could have impact. Such generated simulation results can’t be compared because they are based on different realities. Synergies such as using the traffic demand model from the traffic simulation to include it into the driving simulation can’t be utilized. As a consequence also simulation models may have to be set up multiple times (with the risk of being not similar and therefore creating not the same simulation result). Also feedback loops can’t be used directly: All gained knowledge and simulation results have to be introduced manually into the data set of the other stakeholders.
In our example of replacing an intersection with a roundabout that is also used as a small mobility hub and reducing the number of lanes we need at least the following data sets:
- Detailed road network for traffic simulation and driving simulation as well as sensor calibration. It supports also the visualization and can later-on be utilized for road and robot bus service operations. The visualization can be used for decision making and to include citizens into the discussion.
- On top of the road network a matching traffic demand model should be applied.
- For representation of the surroundings a 3d city model would be beneficial.
- Cadastral data will be used to do the cost estimation. Later-on they will be included in road operation to maintain the urban green, energy supply as well as the road and its infrastructure.
- Operational data can be used to update the current status of the infrastructure assets and can be used for predictive maintenance.
Conclusion
Money is limited and public development projects need a lot of time. The usage of a digital twin can speed up the information exchange between different stakeholders because they use the same data as ground truth. Simulation results can be compared because they are based on the same data foundation. The development process can be accelerated because data have to be provided only once and also updates do not require additional manual work. The newly created data can be used for operations later-on. This is way more suitable than recreating reality multiple times with the risk of deviations in the data and model copies.
Acknowledgement
This feature is based on parts of the journal article “Towards an integrated urban development considering novel intelligent transportation systems“. The journal article also brings together different stakeholders and the processing tool chain.