Geodata in Simulation
March 30th, 2021 | by Marius Dupuis
(7 min read)
This is the first in a series of posts on the use of geodata in simulation. There are numerous applications; for now, we will focus on the mobility sector. So let’s start with a quick overview:
Overview
Simulation tries to resemble reality by means of engineering models; and it comes with a purpose. What data you need and how they are processed depends on the actual application. Within the mobility sector, the most prominent applications for geodata in simulation are:
- development and test of Active Safety Systems, Advanced Driver Assist Systems (ADAS) and Automated Driving (AD) Functions
- infrastructure planning and optimization
- energy management – in mobility devices and infrastructure
- emission and pollution forecasting
- logistics optimization
- communication concepts (e.g. V2X)
- localization
- driver and pilot training
- etc.
Within these applications, we find various components that are being simulated (simplified view):
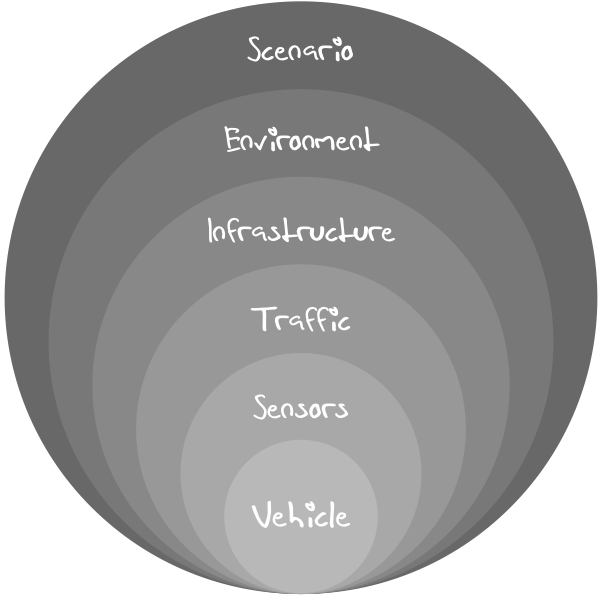
- Vehicle
- The vehicle is composed of various elements. For the discussion in our blog, we are primarily interested in vehicle dynamics and energy management (including emissions).
- The vehicle serves as carrier of sensors by which it perceives its environment. It also influences its environment by performing certain actions.
- The vehicle itself will use geodata mainly in terms of a road’s inherent properties (surface – e.g. for tire contact, elevation – e.g. for energy consumption, curvature – e.g. for handling).
- In the majority of use cases, the system-under-test (SuT) will be integrated into the vehicle (e.g. ADAS or AD function) and will use geodata for navigation, path planning and, as a result, micro routing (on lane level).
- Sensors
- The sensors enable a vehicle to collect data of its own state and the environment.
- Sensors provide their data as input to the actual driving functions of e.g. ADAS components. The data may also be shared with other participants, e.g. by means of V2X systems.
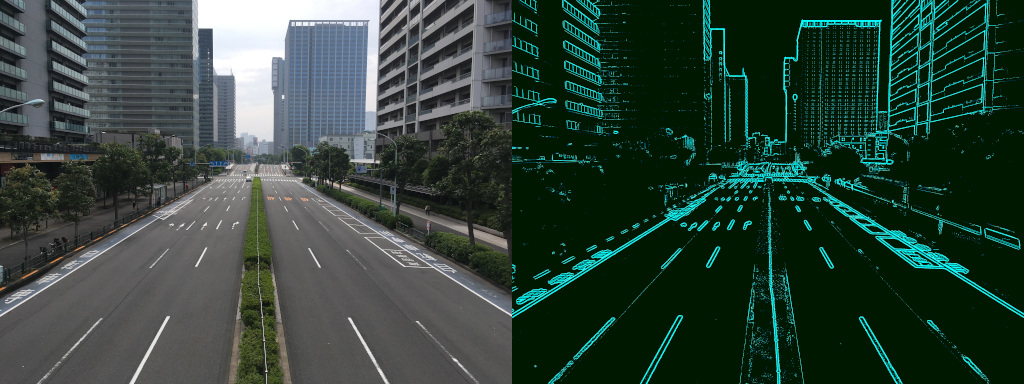
- Sensors will use geodata extensively. Everything that reflects or absorbs energy is of interest – may that be trees and traffic signs on a road, piles of gravel in a mine or crops on a field.
- A map may also act as some kind of sensor in order to compute the so-called electronic horizon that is used for predictive driver assist functions.
- Traffic
- A vehicle hardly ever moves alone in space. There will, at most times, be other participants and time-variant infrastructure components around.
- Traffic simulation covers all static and dynamic objects which are potentially mobile components (e.g. parking and moving vehicles, pedestrians, animals etc.) controlled by an inherent logic (e.g. more-or-less smart actors) and which interact with other potentially mobile components or the environment.
- Traffic simulation is a big consumer – if not the major one – of geodata. Participants have to plan their paths based on road, track or terrain information (lanes, connections, open space etc.), they may consume information provided by the infrastructure (traffic signs and potentially time-variant installations like traffic lights) and they will predict other participants’ behavior based on (country-) specific layouts (e.g. pedestrians crossings) etc.
- Traffic simulation comes in various flavors. This influences the extent to which geodata is required in certain installations:
- nanoscopic (sometimes called microscopic)
The vehicle of interest, i.e. the system-under-test (SuT), is immersed in a surrounding within its sensor range. - microscopic (sometimes called mesoscopic)
Often called “traffic flow simulation” which simulates the behavior of groups or streams of vehicles within an infrastructure layout that can reach city-scale. - macroscopic
Think big! This may cover traffic properties across entire regions, global travel etc.
- nanoscopic (sometimes called microscopic)
- Infrastructure
- Infrastructure is to be treated in two groups – traffic infrastructure and common infrastructure:
- A simulation of traffic infrastructure will typically be covered by traffic simulation itself (e.g. traffic signs, traffic lights, barriers – see previous bullet point).
- The common infrastructure simulation covers all other aspects. Here, we will find the simulation of GPS behavior and signal propagation, the simulation of communication and energy grids etc.
- Infrastructure is to be treated in two groups – traffic infrastructure and common infrastructure:
- Environment
- The environment simulation provides everything that is encountered by a system but which is not part of the traffic or infrastructure simulation. It focuses on buildings, vegetation, weather (in itself a major subject), time-of-day, lighting conditions etc.
- Geodata required for environment simulation includes the exact positioning of features (for localization, ephemeris models etc.), material properties, weather patterns, vegetation data etc.
- Scenario
- Scenario simulation is a consumer and manager of the previously mentioned simulation components. It creates and combines instances of each component and has them executed for a given “concrete” scenario or over a series of “sampled” scenarios which are derived from so-called “logical” scenarios (see also The PEGASUS Project).
- Scenario simulation may derive its parameter space from the underlying data set of which geodata is a crucial part.
The Role of Simulation
No matter whether you look at the classic V-Model of system engineering which applies to many components and overarching concepts in mobility solutions or whether your model is different or less complete in case of prototyping or simple studies: simulation always plays a substantial part in the whole process. It provides all sorts of advantages vs. testing in the real-world, among them increased safety, adaptive complexity, adaptive accuracy and adaptive scale as well as saving time and effort.
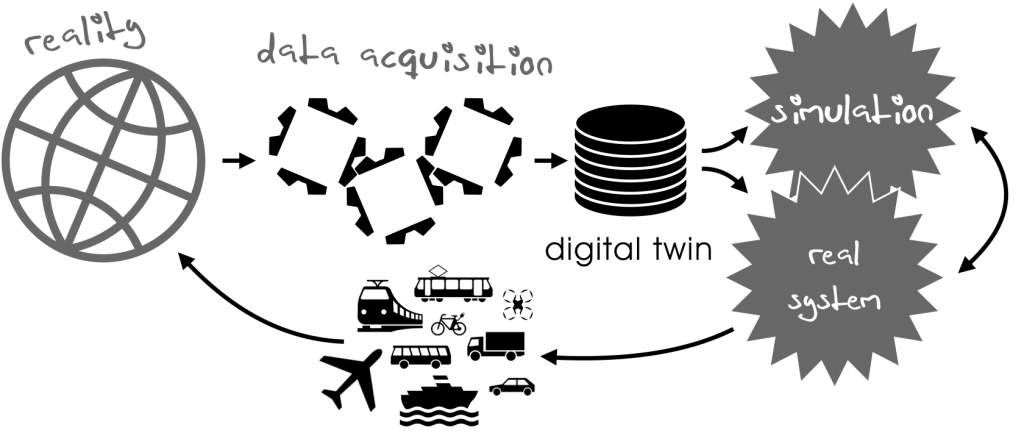
Simulation ain’t reality. As stated above, it provides and uses engineering models for describing reality (the world) or planned reality (systems and components under development). The result of transforming reality into something that can be consumed by simulation is the so-called digital twin.
For geodata the digital twin of the world is created by a data acquisition process. This process, in itself, has to adhere to strict rules in order to guarantee data consistency and sufficient data quality (aspects which we will talk about in other parts of this blog).
In an ideal world (and we propose no less than this), the digital twin serves as a data foundation for both, simulation applications and geodata-consuming components in actual systems (i.e. the stuff that will accompany you on your road trip). At the same time, it has to be ensured that whatever insights simulation provides, they are fully transferable and applicable to the real world (see following figure).
Data Sets for Simulation and Operation
Frequently, data that are used for simulation differ from data that are ultimately used in the productive system (e.g. map data in a head unit). There are good reasons for optimizing the data for each purpose among which you will find:
- optimization for processing effort
- optimization for storage capacity
- maintainability
- readability
Where in an on-board system, optimization for processing power is crucial (due to limited space, energy resources, and limited heat dissipation capacity), you may well crunch through massive loads of data in a simulation system that may have a preference for speed in order to run a large set of simulations in as short a time as possible.
But there is a key requirement: the data sets for simulation and the real system-under-test have to be consistent in all aspects relevant for the development, testing, and operation of the actual system. You may prefer to run a simulation that accompanies your development on exactly the same data that are used in the actual system. But this might limit the speed, accuracy and quality assessment of your results.
In order to assess the operational quality of your system, your simulation data may contain more identifiers than your actual system. These additional data help your development team to compare operations of your system-under-test with the so-called “ground truth” (i.e. the data that the system was supposed to compute from a given input).
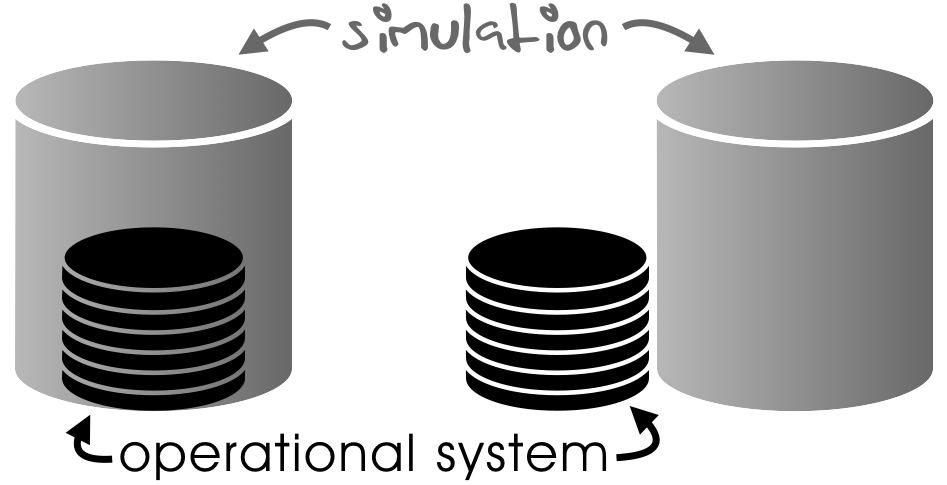
In the best case (in the figure above on the left), the operational data are a strict subset of the simulation data even in terms of formatting. In the worst case (on the right), simulation and operational data are co-existing data sets with no formal correlation.
If you look at the composition of data that are required for the simulation of an actual system, you will always come up with a layered concept like the following:
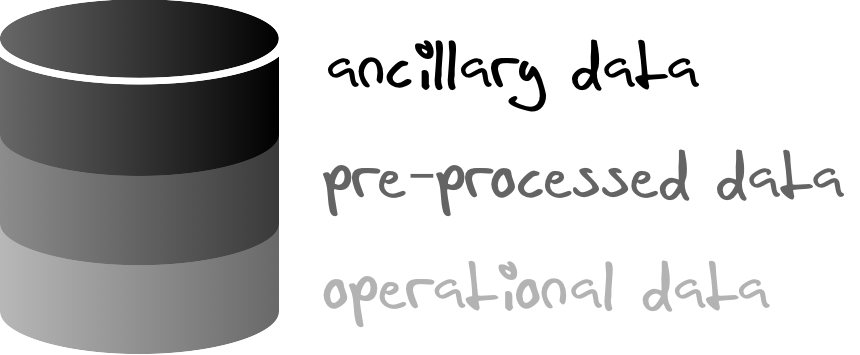
The operational data are, typically, the minimum required data set. This basic set may be annotated by pre-processed data, i.e. data derived from the operational data and cleaned and optimized for further consumption by the simulation (e.g. ground-truth data generated by trusted algorithms which are to be compared to the results of the SuT). Ancillary data that cannot be derived from the operational data typically provide another layer of information. These data are to be generated during the data acquisition process and they are to be stored in or derived from a master database (digital twin).
Data Handling across Domains
The principles described above also apply across different domains. In V2X systems, for example, a traffic participant (e.g. vehicle) will communicate with infrastructure elements (e.g. traffic lights). These elements, on the other hand, will also communicate with other entities within their own domains.
Therefore, there is a need to derive data from the given single entity of reality (digital twin) for different domains in a way that:
- keeps the data consistent between different applications within a domain
- reflects the same reality across domains
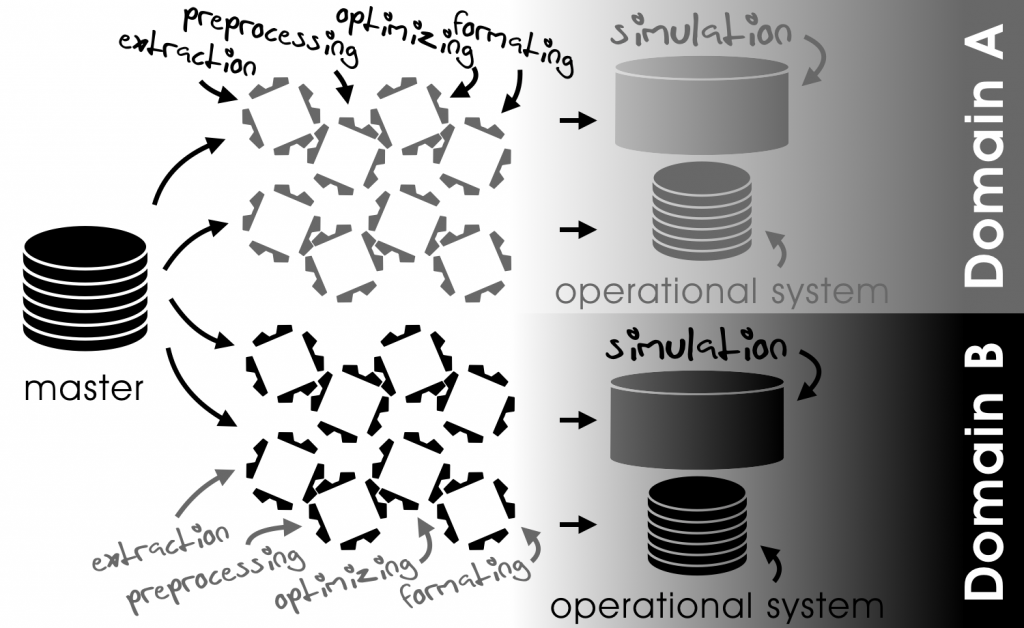
The key to seamless interoperability of the data sets within a domain and across different domains is the lossless transition of data between the systems at any point of time. “Lossless” in this respect means the preservation of the information with respect to its required properties. Data requirements will change during the development cycle of a system – and even continue to do so during its life cycle.
It is worth to think about processing toolchains that derive the necessary data for simulation an the SuT instead of creating specific databases. If parts of the master data are updated or have to be altered, it will be much easier to reuse the toolchain instead of incorporating the changes in the specific databases as well. Also a toolchain can be extended to create exports for additional targets to keep a database in sync with other ones.
Summary
Simulation is based on a digital twin of reality. It contains data for a specific consumer with specific requirements. The correlation with the actual operation of a system determines the extent to which geodata have to be made available. The larger the number of components that have to be considered, the more complex it will be to keep the interoperability of the data. The primary benefits of guaranteeing this interoperability are consistent results across all kinds of simulations.
So much for the first post in this series of posts covering simulation and data within it. Stay tuned for the next one…
I think, driver‘s or – more global spoken – operator‘s behavior is another important application issue of Investigation using simulation methods. For example, investigating into how someone reacts to malfunctions or complete dropouts of assistant systems without causing any danger for the test person, the vehicle used or the environment is another important use case for simulation. And it also needs a digital twin of the world for the tests to be performed in.
Fully agree. Usability and operational safety have been and still are key applications for driver-in-the-loop simulators. If you look at the multimedia concepts in today’s vehicles with large displays etc. it can only be hoped for that all of this has gone through proper assessment in simulators with realistic environments – static and dynamic. And once the driver becomes a mere passenger (with AD functionality) she will have even more time to perceive the virtual environment in a simulator – or the movie on the center display of the vehicle mock-up.
A very good point that leads to the following issue: Motion sickness is a phenomenon, which is often reported, when the role of the driver in an autonomously driving car mutates into the role of a passenger, and when the passenger-driver starts to watch video clips on a built-in media-system, while at the same time the surrounding landscape outside the car is “flying” by. This is perceived in the peripheral view and it often leads to dizziness, at least. Investigations into methods of preventing motion sickness during autonomous driving therefore are another important use case for a man-in-the-loop driving simulator. As driving in a simulator itself might cause simulator sickness symptoms, comparable to motion sickness, a smart approach has to be developed to separate both effects and to make sure, that motion sickness caused by autonomous driving is investigated without the interference of simulator induced sickness.
For many driving simulator applications a geo-specific digital twin of real world roads and the surrounding landscape is essential. Nevertheless, other use cases exist, where the course of the simulated road has to precisely match specific requirements defined by the experiment. These requirements might be specific curve progressions, a predefined slope profile or an exact length of the test track segments, amongst others.
For example, simulator experiments on car dynamics are often done on straight roads with a length of 100+ kilometers. This allows for switching back and force between different car parameters and precisely comparing the driving behavior of the simulated car at constant speed and a repeating sequence of slalom or double-lane-change maneuvers, without the necessity of frequently stopping and accelerating again.
Another example is doing sound engineering in a simulator for vehicles equipped with an electrical power train, for instance. Very helpful for this application is a straight road built out of long sections with constant slope gradients (3%, 6%, 12%, etc.). This requirement easily leads to a track that is climbing from sea level up to an elevation of several 1000 meters that does not exist in reality.
In order to optimize the duration of a simulator ride, a certain length of the test track should not be exceeded. This leads to the requirement of limiting the length of the transition sections between locations along the track, where specific maneuvers take place and data is collected.
Precisely meeting the described road course requirements can only be guaranteed by using generic roads sections to be combined in a tile based database generation process. In addition to using generic roads for the tiles, it might also be useful to cut geo-specific digital twins into tiles, thus allowing combining them, even with generic road sections. This approach gives full flexibility in database design and it allows the creation of test tracks, where the same digital twin can be driven through more than once and without the need to return to the start point, for instance. This is only possible in a simulator, but not in the real world!
I fully agree that these are very important use cases and procedures. I usually think of them as virtual proving grounds that were either impossible or too expensive to be built in reality (e.g. a few 100km of continuous road with given curvature sequences). So, we see here that simulation can go well beyond reality and that sometimes geodata has to be “made up” in order to fulfill a certain task.
Now the question is whether we want to consider these elements as a part of the digital twin (of a non-existing reality) or whether they have to be treated separately.
The formal meaning of digital twin may prevent an inclusion of virtual proving grounds. But on the other hand, they also need to be made available for specific use cases which can be relevant for various stakeholders (see the corresponding post). The only problem we would have if we formally included virtual proving grounds in the digital twin is the missing feedback loop to reality. But that might not be necessary at all.
In summary, a very interesting aspect and we should definitely elaborate further on it in an upcoming post…