Expert Talk: The Unfolded Truth Becomes a Tangible Asset
July 25th, 2022 | by GEONATIVES
(5 min read)
For the conversion of the digital world into a tangible asset you might be thinking of 3d printing in the first place. But go back a bit more in time and imagine how you might have built models in your childhood days: cut some paper prints, bend the glue tabs, apply the glue, and make sure your fingers don’t stick to the resulting 3d structure.
When we first heard about the paper “Automatic Unfolding of CityGML Buildings to Paper Models“ by Steffen Goebbels and Regina Pohle-Fröhlich of Krefeld University, we were originally set back to this childhood mindset. But soon we learned that there are current use cases that might make a (literally) lightweight conversion of digital 3d models into scaled real-world 3d models an attractive feature.
Nevertheless, many questions and a certain level of curiosity around the people behind the paper remained. Therefore, we invited Steffen Goebbels for a GEONATIVES Expert Talk session in June 2022.
Steffen Goebbels is lecturing mathematics for engineers at the University of Applied Sciences “Hochschule Niederrhein”, Germany, and is researching at the iPattern institute which focuses on pattern recognition (in the broader sense) including information retrieval, speech recognition and graphical data processing. He and his colleague Regina Pohle-Fröhlich came across the subject of digital city models by activities in the area of geodata (e.g. by working with publicly available aerial LIDAR scans provided by the federal state).
When looking at CityGML data of LOD 2 they recognized that the models available in North Rhine-Westphalia and in the university’s hometown Krefeld in particular didn’t show the variety of roof shapes that you would typically find in that part of Germany. A key example of complex roofs are churches – and it’s obvious that they don’t appear as too realistic with a single flat shape alone.
So, the university team started to combine data from different sources – CityGML, aerial LiDAR scans and oblique aerial images and were able to derive not only more realistic roof shapes but they could also apply a new set of textures to the 3D models.
They figured out that unfolding the 3D models was an excellent means to identify any inconsistencies in the data sets. You can easily see whether texture alignment at adjacent faces sharing an edge is correct and you may be able to adjust color temperatures and histograms. Also, any issues in the geometry of the models become evident once you try to unfold them: Sometimes layouts are not fitting to the point clouds; sometimes a wrong projection is used.
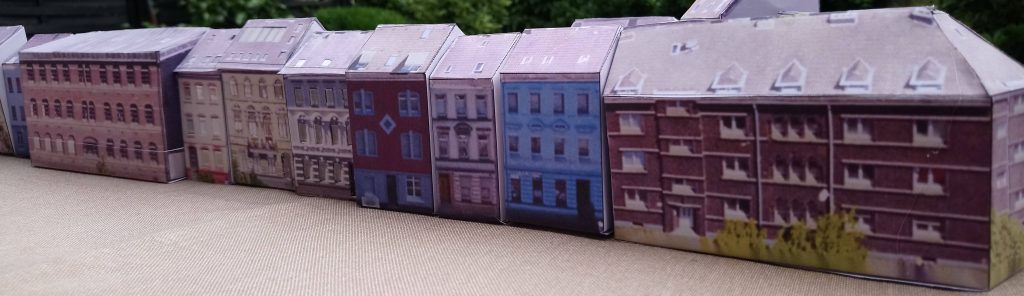
As we learned, many cities still rely to a large degree on tangible 3d models, for example, in order to illustrate the impact of construction projects on a neighborhood. For various practical reasons, not least for cost considerations, these models tend to be simplified (in terms of coloring and texture). Building them, though, is a tedious process and requires considerable work hours and material.
The results are the often seen and frequently dust collecting, expensive and “pale” models that make it to a dark corner once they have served their purpose. Using automatically unfolded, full-color paper-printed models instead, opens the door to creating in a relatively quick fashion a realistically looking 3d representation of a neighborhood that allows at least for a good first impression of a situation.
The tooling of the Krefeld team was ready at a time when COVID-19 struck. So, they deemed it a good opportunity to spend their time printing, folding, and gluing their models and arranging them accordingly. They did models of buildings with up to two dormers in the roof at a scale of 1:220 (which conveniently fits model railway track size Z and doesn’t consume unmanageable amounts of paper for printing). The appearance of the models was improved by manually correcting the texturing where necessary.

Overall, the texturing and unfolding process is sufficiently automated so that hardly any manual work remains except for filling the usual gaps in the texture sets and, of course, cutting the paper and applying the glue.
Why, again, did they start this project? Because it was an interesting thing to do! The existing geodata is a playground for applied computer science. Many mathematical essentials can be illustrated using geodata as vivid example. In our talk with Steffen Goebbels, we clearly recognized that he is a fully engaged researcher and teacher. The technologies he developed are available as open source and he is using them as a basis for further student projects. It will also be integrated into KIT’s CityGML viewer FZKViewer. The latest projects are about finding roof edges in aerial images and automatic removal of vegetation from images of facades. Additionally, roof overhangs shall be added in a procedural way.
Asked about his experience with CityGML itself and the importance of the format vs. the tooling, he reminded us of what we have already postulated in our post about data processing: the format itself doesn’t play the key role if the tooling is intuitive, consistent, and covers the most frequent use cases. In his application, the viewer was the key tool.
With their work, Steffen Goebbels and Regina Pohle-Fröhlich added to the tooling an application that does a great job in applying oblique aerial images to existing 3d models and verifying the correctness. Until then, although some tooling existed for the verification of 3d model geometry (e.g. CityDoctor) it was mainly a manual (i.e. visual) task to verify the texturing of models.
Building Bridges
Before closing our expert talk, Steffen Goebbels pointed us to another project his team has been conducting: Using, again, the 3d LiDAR data mentioned above, they are able to automatically create virtual 3d models of bridges which might otherwise be missing in 3d virtual city models.
Bridges come in a finite number of types (seven main types like beam bridge, truss bridge, suspension bridge etc.) and each type follows certain rules. Therefore, analyzing the sometimes-sparse LiDAR data and identifying frequencies of vertically aligned measurement points helps not only determine the bridge type but, for example, also the distances between vertical suspenders in case of a suspension bridge.
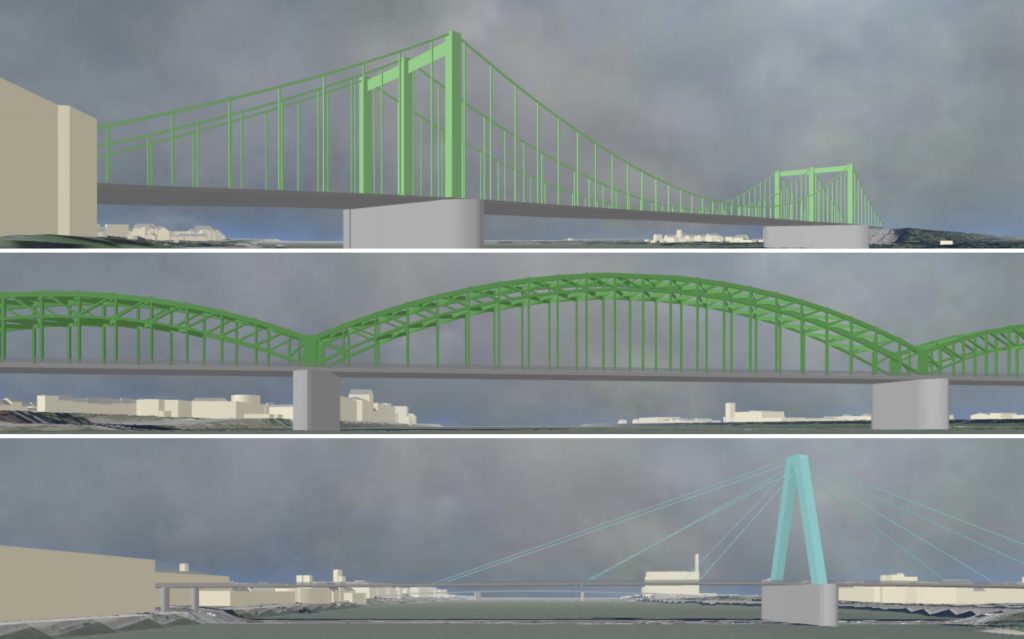
Adding to this pattern recognition analysis some knowledge about bridge type design itself results in pretty sophisticated and realistically looking 3d models. As a proof, we were shown a series of virtual 3d bridge models crossing the Rhine near Cologne, Germany.
Summary
Follow your curiosity!
By coincidence, we had come across a paper about unfolding virtual city models, which was created by a team with a curiosity about new methods to verify the texturing of virtual 3d models.
It all turned out into a great expert talk and lots of inspiration. Thanks again to our guest, Steffen Goebbels, and his entire team!
Reference
Goebbels, S.; Pohle-Fröhlich, R. Automatic Unfolding of CityGML Buildings to Paper Models. Geographies 2021, 1, 333–345. https://doi.org/10.3390/geographies1030018